Dustin Lang (Perimeter) and I spoke today about many things, but the conversation got de-railed when Lang showed me his visualizations of the brand-new NASA SPHEREx data. Oh. My. Goodness. First of all, the data are being released daily, before the team has done its analysis, so that anyone in the world can do anything with it. Talk about open! Talk about international! Talk about everything I believe about astrophysics! Also, the data are well documented, high in signal to noise, and released with good and useful metadata. This is killer. Of course Lang has already made a viewer for it and can do all comparisons to the DESI data. Get in touch with him if you want tools.
Showing posts with label visualization. Show all posts
Showing posts with label visualization. Show all posts
2025-07-18


2023-11-07
abundance gradients wrt positions or actions
It is traditional to plot things like the mean iron abundances of stars (or ratios of magnesium to iron, or other ratios) as a function of position in the Galaxy. However, stars change their positions over time, so the gradients (the features in any abundance–position plots) will be smeared out over cosmic time by their motions.
At the same time, stars have approximately invariant actions or integrals of motion, which don't change (much) as they orbit. These invariants are only approximate, both because the Galaxy isn't exactly integrable, and also because we don't know or measure everything we need to compute them precisely for any observed star.
Putting these two ideas together, the abundance–action features, or really abundance–invariant features should be much clearer and more informative than the abundance–position features. Awesome, let's go! The only problem is: Selection effects are often simple in the position space, but are almost never simple in the dynamical-invariant-space. So any plots are harder to interpret generally.
These are issues that I have discussed over many years with Hans-Walter Rix (MPIA). Today I discussed them with Danny Horta (Flatiron) and Adrian Price-Whelan (Flatiron), in preparation for an exploratory study by Horta.
2023-07-31
raw data from Cassini
One thing we discovered this past academic year is that NASA Cassini took more than 300,000 images of Saturn's rings! Today I met with Maya Nesen (NYU) and Ana Pacheco (NYU) to look at Cassini raw spacecraft data. Nesen is working on the tabulated housekeeping data, giving the position and orientation of the spacecraft and instruments in various coordinate systems (that we are trying to work out). Pacheco is working on the raw imaging data from the imaging module. We discussed how to display the imaging so that an astronomer can confirm the the noise level and rough noise properties in the pixels. We discussed adjustments to our plots of the housekeeping data to aid in our interpretation of it. In particular, we looked at some of the camera-related meta data and it looks like the camera might have a few different zoom settings. I guess we have to read some documentation!
2022-10-13
abundance gradients in the Milky Way
I had an absolutely great meeting this morning with Danny Horta-Darrington (Flatiron) and Adrian Price-Whelan (Flatiron), in which Horta showed us plots of various stellar surface abundances as a function of dynamical quasi-invariants in the Milky Way. That is, abundance gradients! But abundance gradients get stronger and more informative when they are plotted in terms of dynamical invariants than when they are plotted versus position (say), because positions of stars change with time. There is so much information for us to use here!
One thing we discussed is what units or transformations of the dynamical invariants we should plot. We're leaning towards the transformations that have units of length, which are guiding radius, z-max, and radial span.
2022-10-12
infographics?
I find it hard to admit to myself that I (and collaborators) are considering submitting a manuscript to Nature Communications, which is part of the evil publishing empire (though at least it is Open Access). I have been pretty morally pure on this point for many years. But! It is hard to find publishing venues that are truly interdisciplinary. And many of those venues are bad (pirates even, and I don't mean that in a good way).
If we are going to publish in Nature Communications then we need an infographic or good visuals. Today, Soledad Villar (JHU) and I worked through possible visuals and design ideas for a good infographic. I have to say that I benefitted enormously from the extremely informative and compact visualization that Lily Zhao (Flatiron) made for Excalibur (Figure 1 of this paper).
2022-09-27
patches of imaging
I am discussing with Sean Ku (NYU) and Victor Kuang (NYU) the NASA Cassini imaging of Saturn. We want to make (from the data) a high-quality face-on picture of the rings. This is a problem (from my perspective) in computer vision, so we need a camera model (and a lot of other things). One thing I hypothesized about this problem today is the following (am I right?):
Any sufficiently small patch of a camera image can be modeled with a pinhole-camera-like camera model, provided that we give the camera model the freedom to make the image plane not perpendicular to the line from the pinhole to the patch of the image plane. Is this correct? We are about to find out, the hard way.
2022-09-02
a gallery of tensor images
I spent some time working on a possible introduction figure for the paper I am writing with Soledad Villar on images and grids and lattices of geometric objects (like scalars, vectors, and tensors). This introduction figure would give a set of examples of different kinds of data that come up in natural-science contexts. This is all a great idea! But then I need to understand (and explain!) exactly what each image in the gallery shows, and also get permissions to republish. Worth it (I hope).
2022-08-08
do the stars make up a coordinate system?
Long, long ago, when I worked with Sam Roweis (deceased) and Dustin Lang (Perimeter) on locating images on the sky, we used to discuss coordinate systems: You don't actually need a long-lat or theta-phi coordinate system to describe the locations of things on the sky, right? You can just use angular relationships among sources to locate everything precisely and unambiguously! And with that approach, you don't need to make as many choices and standards and lines of code about reference frames. But, alas, this point of view is not in the ascendent.
Not being deterred, I put the bright stars on my maps (from this weekend) of Kate Storey-Fisher's ESA Gaia quasar sample. Can you find the big dipper and Orion? And Sirius?

2022-08-07
Lambert's projection
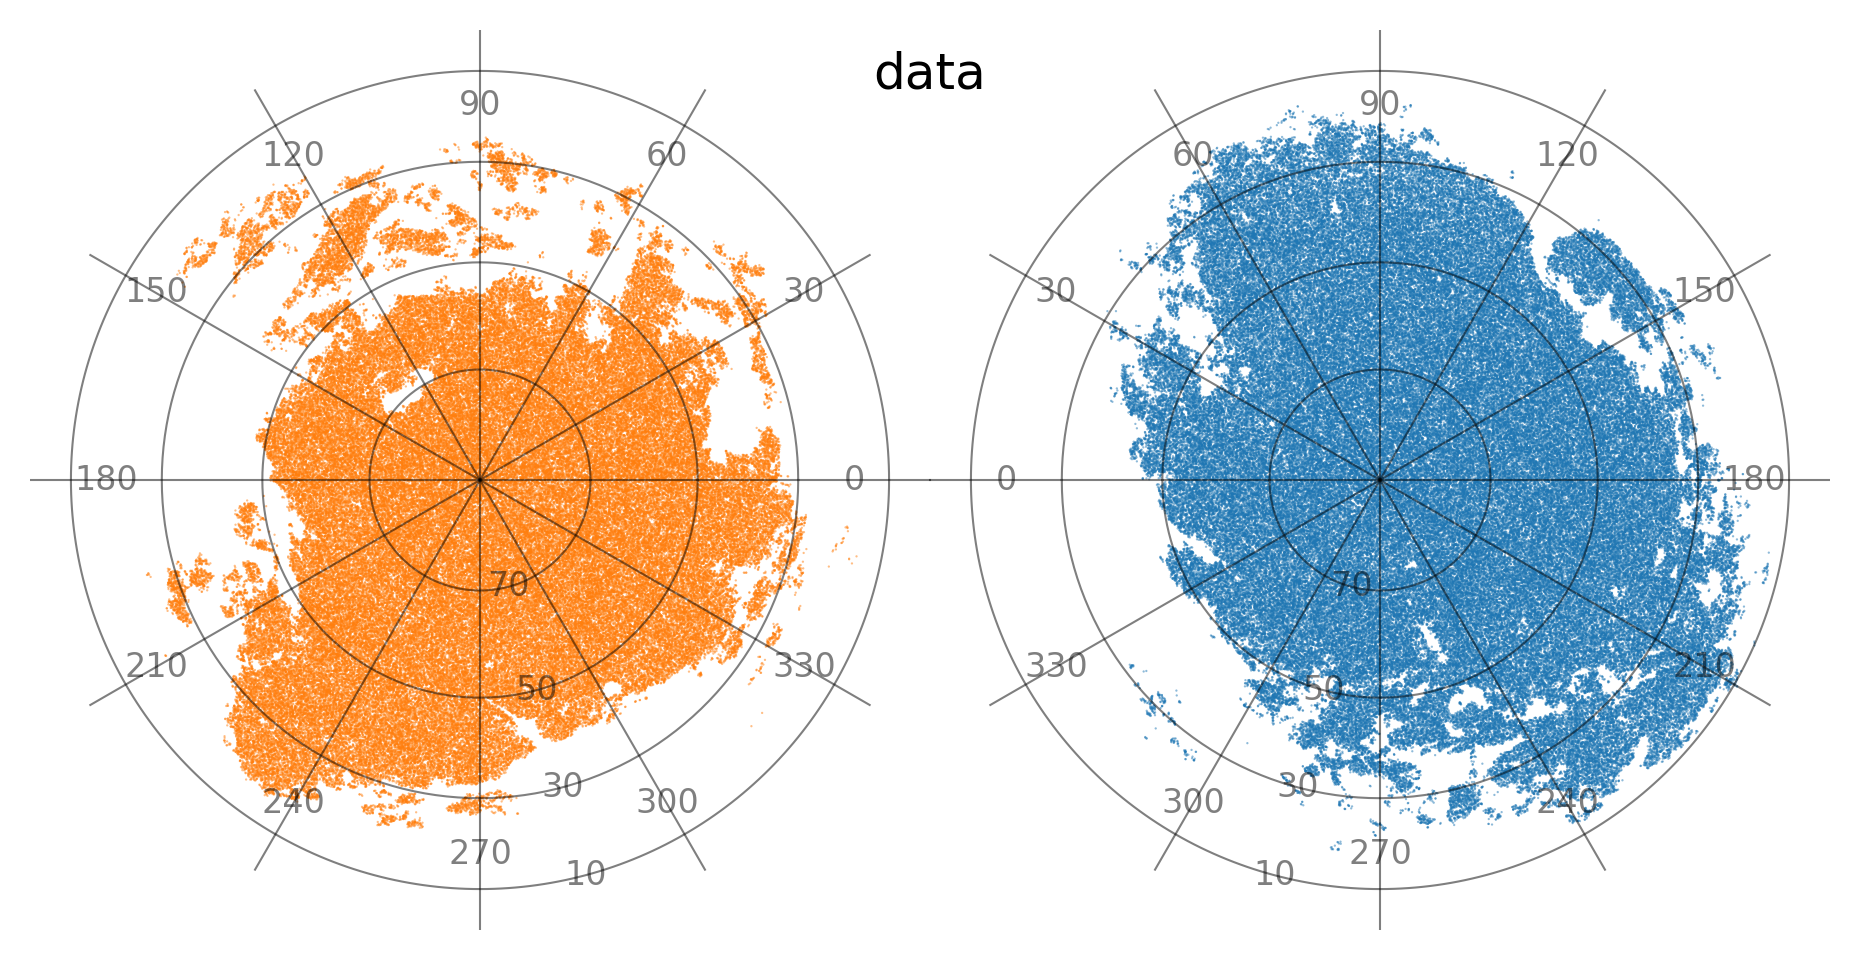
At the Heidelberg Tiergarten Schwimmbad I worked out the mathematics for an equal-area projection of the sphere, centered on the poles. It turns out that I reinvented Lambert's projection from the 1770s. Here's a plot of the Gaia DR3 quasar sample (censored by some dust cuts) in my new projection:
2022-08-02
visualizing a tensor field
I am working with Soledad Villar (JHU) and others on making generalizations of convolutional operators (and image-based non-linear functions based on those convolutions) that can deal (correctly) with input data that contain vectors and tensors. That is, tensor convolutions of tensor images. Anyway, one of the problems is: How do you visualize a tensor field or an image of tensors? I implemented a possible solution, pictured below: You make a figure that has no symmetry, and you take that figure through the tensor! That only works for 2-tensors of course. 3- and 4-tensors? I'm at a loss.

2022-07-09
Gaia quasar redshift distributions
Today I worked with Kate Storey-Fisher on the ESA Gaia quasar sample. We looked at the redshift distribution as a function of magnitude and as a function of color cuts or selection. Right now we are getting an odd angular correlation function for the sample, which we think is because our random catalog (or completeness model) is wrong in important but subtle ways. Interestingly, there are probably terms coming from both the dust map (extinction) and from the Gaia internal completeness (scanning law) and maybe both contribute enough to change the answer? But it sure looks like dust dominates.
2022-07-08
Doppler shifts and radial velocities
I am a big believer that there is a difference between a Doppler shift and a radial velocity. For one, they have different units! For another, the former is measurable (sometimes) and the latter is not (or rarely). But today I agreed with Megan Bedell (Flatiron) that we should write our paper on the subject in terms of the words “radial velocity” and not “Doppler shift”. After all, we are talking to a community with a common language! I spent some time on the train from Vienna to Heidelberg editing the figures for our paper on this subject.
2022-06-23
Gaia Hike, day 4
On day 4 of the Gaia Hike, Neige Frankel (CITA) and I tried to look for the signature of the Snail (the vertical phase spiral in the Milky Way stellar kinematics) in metallicity. It's visible in the Gaia Collaboration chemical cartography paper. But it's not trivial to find it. We got a tiny hint of it using RVS metallicities, and we resolved to try some more tomorrow. We also figured out that it should be there even if the Snail is a late production of a late interaction: Abundance gradients FTW.
2022-06-20
Gaia Hike, day 1
Today was the first day of the Gaia Hike hosted at UBC and led by Neige Frankel (CITA). The day started with business cards (short intro talks from everyone), followed by an attempt to find common themes across participants. Once the themes were identified, we split into groups to talk about what we might do this week with the ESA Gaia DR3 data. I ended up in a mapping and visualization group, which was fun, and (of course!) we closed out the day hacking on a piece of the data on stellar parameters, trying to figure out why the stellar parameters don't look exactly as we expect.
2022-02-05
figures for a paper
I'm trying to finalize the figures for my paper with Megan Bedell (Flatiron) about measuring radial velocities precisely. I have so many considerations for figures, and they get a bit challenging: Figures should be readable, unambiguously on a black-and-white printer or display. Figures should have aspect ratios such that they can be cut easily into presentation slides. Figures should have large text such that they are readable at a glance. Ink on figures should be used in proportion to the importance of the point being made (more ink on more important data, for example). Data should always be dark and black-ish, models can be light and colored. Figures should be readable by people with (at least) the most common form of color-blindness. Lines and points should be distinguished not just by hue but also by value. The same quantities on different plots should be plotted in the same point or line style and the same color, with the same label and same range. And so on!
2022-01-03
a phase diagram for sailboats
Matt Kleban (NYU) and I are finishing up a paper on the theoretical basis for sailing (yes sailing). One of our conclusions is that (large) sailboats are described by three dimensionless ratios: The sail-to-keel ratio, the ratio of the sail working force to the air drag force, and the ratio of the keel working force to the water drag force. We imagined today a phase diagram that shows the space of dimensionless ratios that permit, for example, upwind sailing. And sailing downwind faster than the wind. And sailing cross-wind faster than the wind. And so on.
2021-07-15
maps of Hessian eigenvalues for gap-finding
As my loyal reader knows, Gaby Contardo (Flatiron) and I have been looking for gaps (valleys, voids) in point clouds using geometric methods on density estimates. Today she just did the very simplest thing of estimating the largest eigenvalue of the second-derivative tensor (Hessian of density with respect to position), and visualizing it for different density estimates (different bandwidths) and different bootstrap resamplings of the data. It is obvious, looking at these plots, that we can combine these maps into good gap-finders! This is simpler than our previous approaches, and will generalize better to higher dimensions. It's also slow, but we don't see anything that can be fast, especially in “high” dimensions (high like 3 or 4!!).
2021-06-29
the baryon-induced displacement field
Today Kate Storey-Fisher (NYU) showed me very nice visualizations of two matched simulations, one dark matter only, and one dark matter plus baryons. The simulations are matched in the sense that they have identical initial conditions, the only difference is that the latter simulation has baryon physics, such as cooling, star formation (approximately), AGN feedback (approximately), and so on. The simulations are from the IllustrisTNG project.
The thing that is interesting to us is whether we can model the differences between the simulations, and in particular whether building such a model will lead to insights about the fundamental physical mechanisms that lead to the differences. Large-scale gravity, after all, doesn't care about the small-scale composition or state of the matter; it only cares about the mass, so why are these simulations different at all? Of course there are lots of things about baryon physics that move matter, so it isn't a paradox, it's just interestingly non-trivial.
Now the question is: If we throw some gauge-invariant machine learning at this problem, will it lead to new insights about physical cosmology? That would be a real win.
2021-06-20
more sailing
I spent the weekend in an undisclosed location working on my ram-pressure model for a sailboat. I realized that there are multiple models, even if you decide that it will be ram pressure! I coded up multiple models, and also worked on writing text. I made figures like this one!

2021-05-14
regression as a tool for extreme-precision radial velocity
Lily Zhao (Yale) showed new regression results to Megan Bedell (Flatiron) and me today. She's asking whether shape properties of a stellar spectrum give you any information about the radial velocity of the star, beyond the Doppler shift. The reason there might be some signatures is that (for example) star spots and pulsations can distort radial-velocity measurements (at the m/s level) and they also (very slightly) change the shape of the stellar spectrum (line ratios and line shapes and so on). She has approaches that are \emph{discriminative}—they try to predict the RV from the spectrum—and approaches that are \emph{generative}—they try to predict the spectrum from the RV and other housekeeping data. Right now the discriminative approaches seem to be winning, and they seem to be delivering a substantial amount of RV information. If this is successful, it will be the culmination of a lot of hard work.
Subscribe to:
Posts (Atom)